Amazon PPC and Search: Harry’s
Proposal By: Jennifer Layton
December 12th, 2019
Introduction: Harry’s launched in 2013 as a direct-to-consumer company with the mission “that was built out of respect for quality craftsmanship, simple design, modern convenience and for guys who know they shouldn’t have to overpay for a great shave.” (Source: Harry’s LinkedIN). In August 2016, Harry’s also became available at retail exclusively at Target stores (Source: Target.com). The brand is also expanding its retail footprint to Walmart (Source: Fastcompany.com).
Audience: Harry’s target audience is millennial men prioritizing convenience and price when shopping for their grooming products.
Business Goals: As a primarily direct-to-consumer company, Harry’s main objective is to sell product. All ROI measurements should latter back to this objective.
Data Collection Recommendation:
- SEMRush: After identifying the likely keywords your customer may use based on product and audience details, use SEMrush which “will provide a list of related terms that you can easily download into a CSV file.” (Source). From there, you will start to understand the most relevant search terms for products.
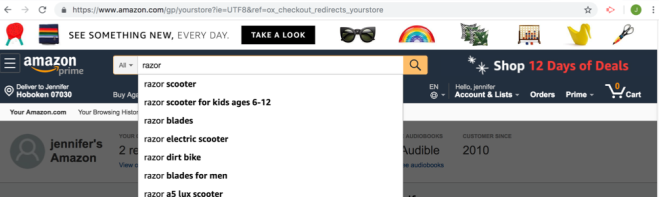
- Amazon Autofill: Additionally, I recommend starting to enter keywords you have identified into Amazon’s search field to see what begins to auto-populate. This is yet another insight into identifying relevant search terms. (Source).
- Scope: This Amazon SEO research tool “allows sellers to search for relevant search terms based on initial search phrases, as well as search terms for competitor listings”, which is extremely important knowing the competitive nature of the grooming category. (Source).
 (Source)
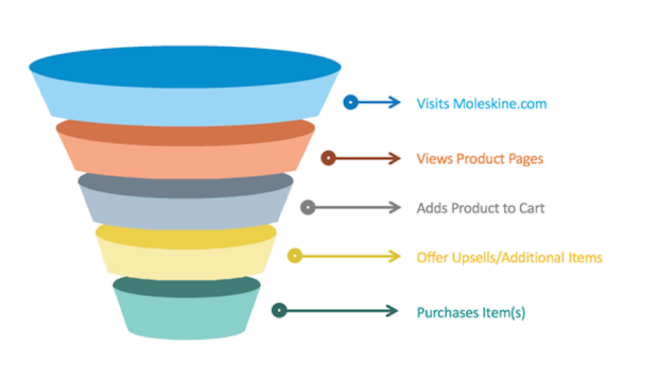
Conversion Data:
- Micro Conversion: Clicking on advertisements on Amazon’s website are a measure of a micro conversion (which leads to the overall macro conversion of purchase).
- Macro Conversation: The macro conversion is purchase of Harry’s product(s) on Amazon.com, which directly links back to Harry’s business goal of selling product.
Recommended Amazon Products:
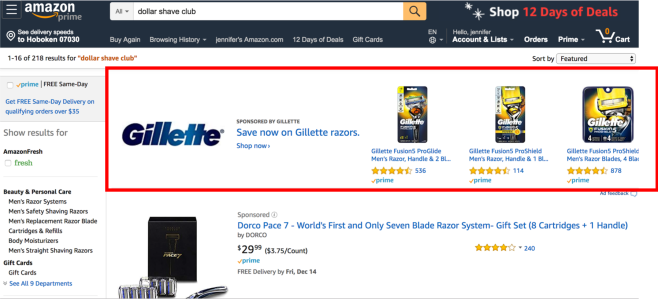
- Enhanced Reporting Insights: Because Harry’s is in a very competitive category, it is important to best understand keywords and placements. “Analyzing performance by placement regularly will ensure that you don’t miss any shifts in key metrics.” (Source)
- Custom Bid Adjustments: As Harry’s is a newer brand and budget’s for advertising spend must be considered. Using custom bid adjustments can manage additional ad placements more effectivity and efficiently, while also ensuring that conversion rate and average CPC align. (Source)
 (Source)
Additional Recommendations:
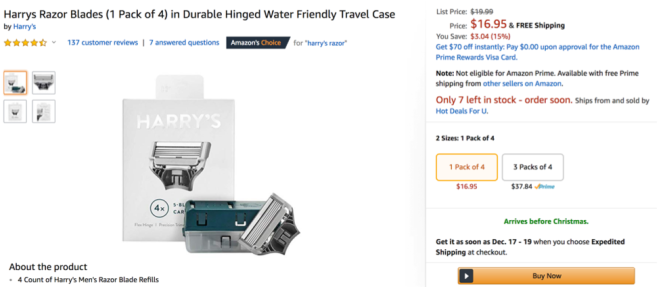
- Ensure all product information (including metadata, product title, images, bullet points and product descriptions) are accurate. Remember there is often incorrect information on Amazon for your product from other counterfeit or third-party sellers. (Source)
- Boost quality of all product listing with Enhanced Brand Content and A+ ages which help brands market their products and lead to stronger conversion rates. (Source)
- Offer more value to consumers via coupons, offers or product bundles. (Source)
 (Source)
Conclusion: The Harry’s brand, category and audience where all considered within this proposal. Amazon products consider the fact that Harry’s is in a highly competitive category and must have insight into competitor activity. Additional recommendations consider leveraging the great content Harry’s is already producing on their owned platforms.


 In Shadrow’s article, it states, “The top metrics to track are the number of followers you attract and keep, along with cost per lead and cost per acquisition” (